


Your infrastructure, visible and actionable.
A real-time monitoring dashboard that brings together everything you run: Coolify deployments, BullMQ queues, PostgreSQL metrics, and VPS health—all in one unified view. Built with Next.js 16, React 19, and TypeScript for a fast, modern experience.
If you self-host applications with Coolify, you've probably felt the pain of context switching: checking deployment status in one tab, queue health in another, server metrics somewhere else. This dashboard solves that by bringing everything together.
Before: Five different tools, constant tab switching, mental overhead remembering where to look.
After: One dashboard, real-time updates, immediate action when things break.
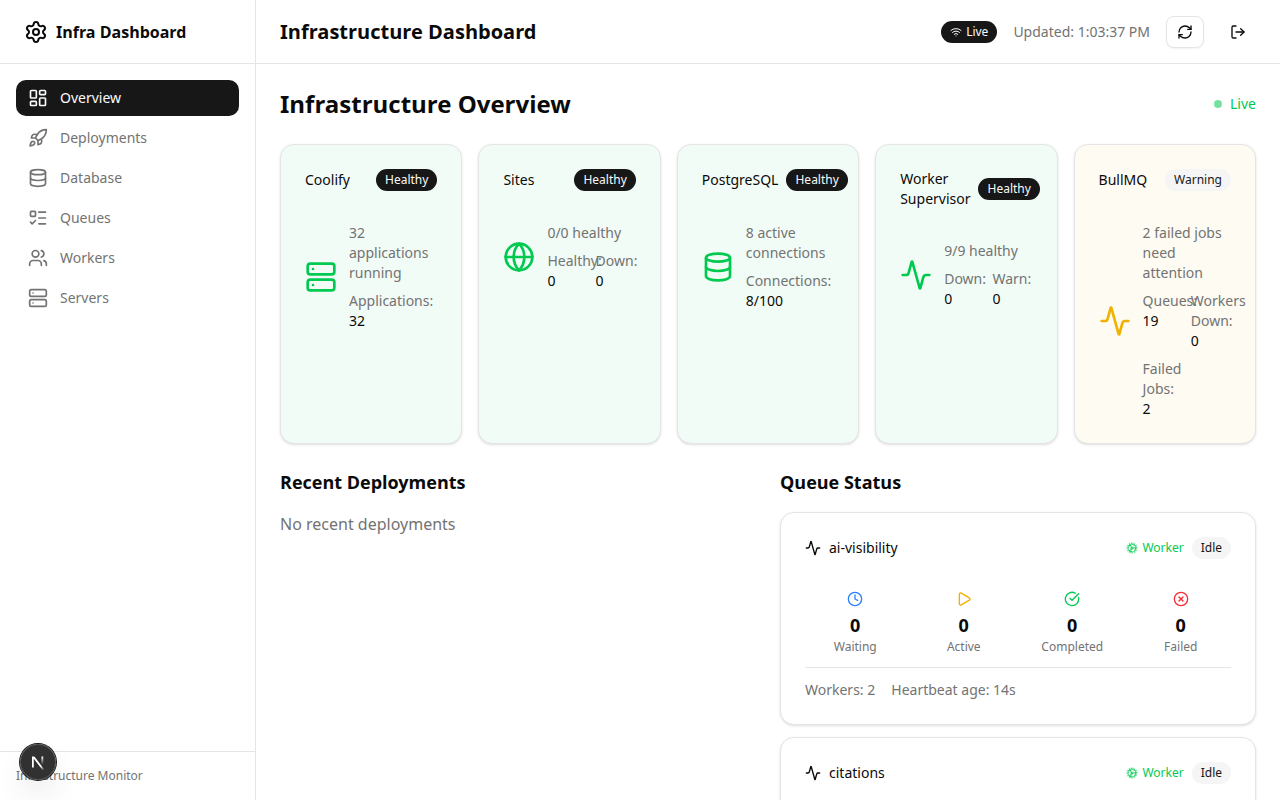
More screenshots
| Coolify Deployments | Queue Management |
|---|---|
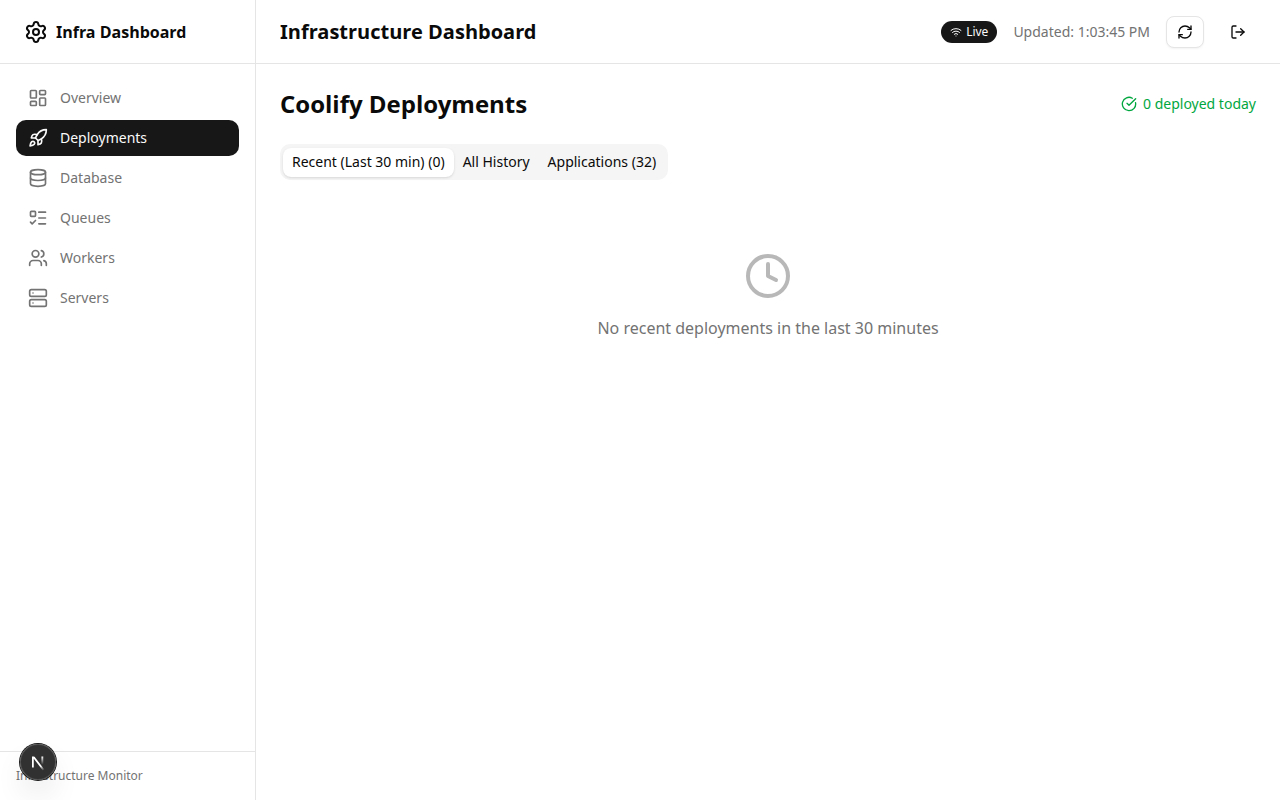 |
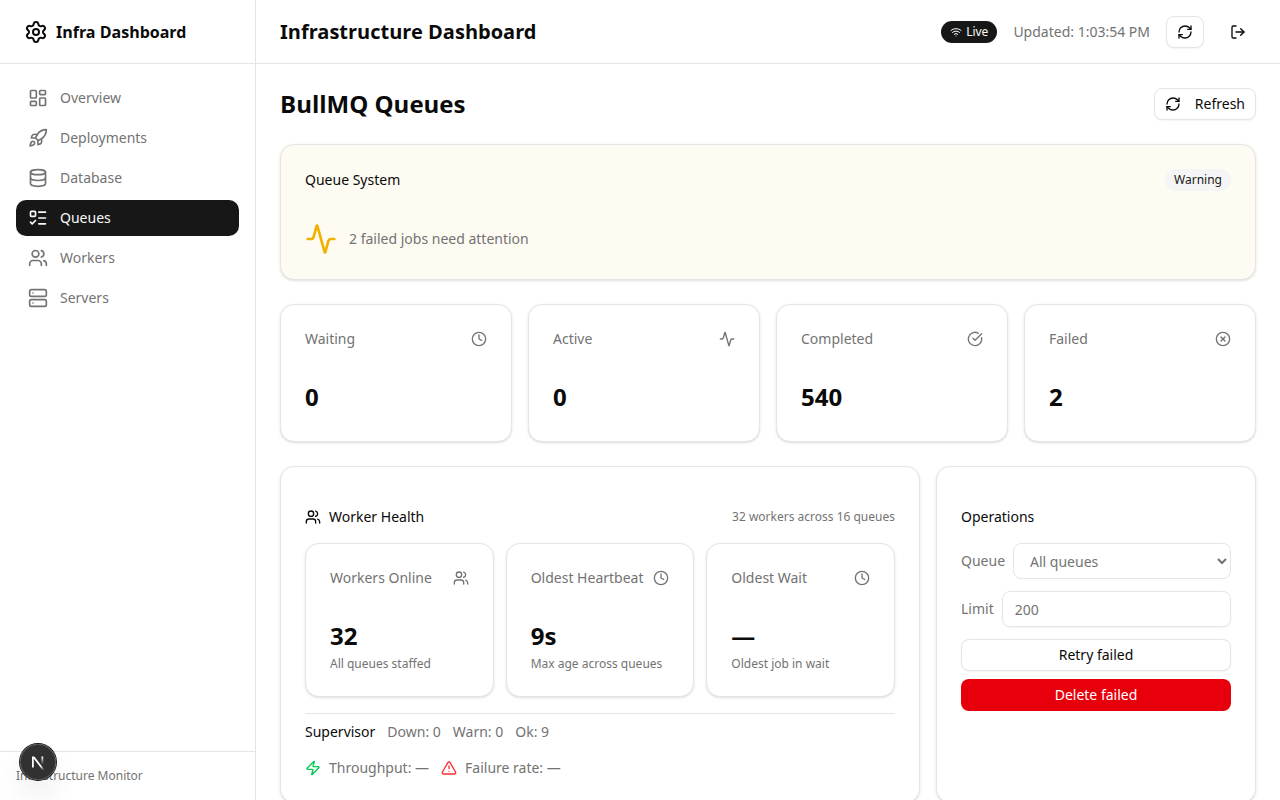 |
| PostgreSQL Metrics |
|---|
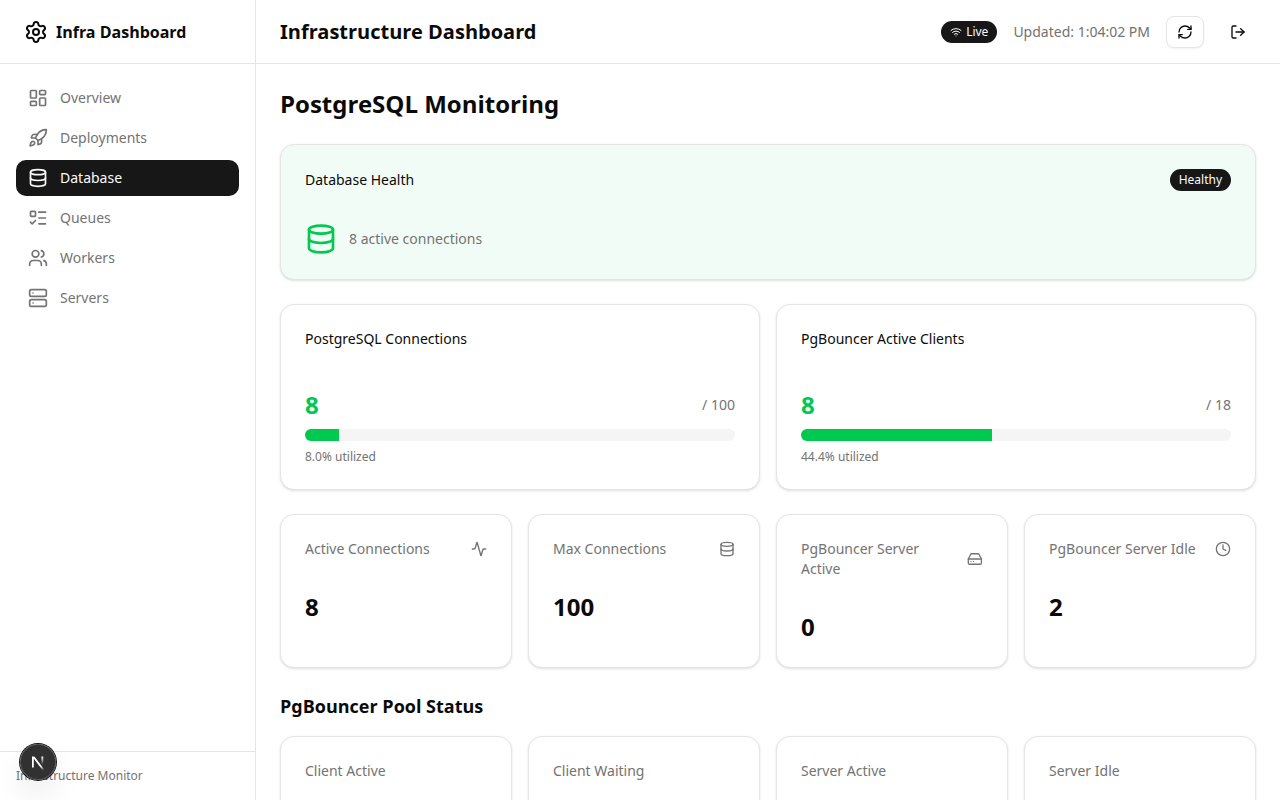 |
git clone https://github.com/cvsloane/infra-dashboard.git
cd infra-dashboard
cp .env.example .env.local  # Edit with your credentials
npm install
npm run dev                 # http://localhost:3000
Prerequisites: Node.js 18+, npm 9+, and a Coolify instance to connect to.
| Feature | What It Does | Why It Helps |
|---|---|---|
| 📊 Overview Dashboard | Unified infrastructure health at a glance | Know the status of everything in seconds, not minutes |
| 🚀 Coolify Integration | App status, deployment control, real-time build logs | Manage deployments without leaving the dashboard |
| 📬 Queue Management | BullMQ stats, worker health, bulk job actions | Fix failed jobs and monitor queue performance |
| 🐘 PostgreSQL Monitoring | Connection pools, PgBouncer stats, per-database metrics | Spot database bottlenecks before they impact users |
| 🗄️ Backups | Logical dumps, WAL, WAL-G, restore drills, and host-level Restic freshness | Verify both database recovery layers and encrypted host snapshots |
| 🖥️ Server Metrics | CPU, memory, disk, load averages | Understand resource usage across your infrastructure |
| 🔍 Site Health | HTTP status and SSL certificate checks | Know immediately when sites go down or certificates expire |
| ⚙️ Worker Supervisor | Systemd/PM2/Coolify worker health monitoring | Ensure background jobs are always running |
| 🩹 AutoHEAL | Automatic restart/redeploy for failing services | Reduce downtime without manual intervention |
| 🤖 Agents | Background automation run tracking | Monitor scheduled tasks and maintenance jobs |
| 🛡️ Child DNS Logs | Store NextDNS activity per device and flag silent expected devices | See domain-level activity and catch devices that stop reporting through NextDNS |
Each guide is designed to be self-contained—start where you need help:
| Guide | Description | When You Need It |
|---|---|---|
| Getting Started | Installation and initial setup | First time setup |
| Configuration | Complete environment variable reference | Customizing your setup |
| Coolify Setup | Deep dive into Coolify integration | Connecting to Coolify |
| Prometheus Setup | Metrics collection with exporters | Adding VPS/DB metrics |
| BullMQ Setup | Queue monitoring configuration | Monitoring job queues |
| AutoHEAL Setup | Automatic recovery system | Enabling auto-remediation |
This repo keeps dashboard-specific lessons in tasks/lessons.md. Broader VPS, DNS, Coolify, Rocket.Chat, M365, and service-ownership knowledge remains canonical in SloaneVault under /home/cvsloane/SloaneVault/, especially tasks/lessons.md, tasks/decisions.jsonl, and the VPS infrastructure runbooks.
Mirror only the dashboard-relevant slice here: collector assumptions, health semantics, alert thresholds, service inventory modeling, and places where the UI could misrepresent an infrastructure fact.
┌─────────┐     HTTPS      ┌─────────────────────────┐
│ Browser │◄──────────────►│   Next.js App           │
└─────────┘                │   (standalone build)    │
                           └───────────┬─────────────┘
                                       │
              ┌────────────────────────┼────────────────────────┐
              │                        │                        │
              ▼                        ▼                        ▼
        ┌──────────┐            ┌──────────┐           ┌─────────────┐
        │  SSE     │            │  API     │           │  Direct DB  │
        │  (15s)   │            │  Routes  │           │  Connection │
        └────┬─────┘            └────┬─────┘           └──────┬──────┘
             │                       │                        │
             ▼                       ▼                        ▼
       ┌──────────┐           ┌──────────┐            ┌─────────────┐
       │ Coolify  │           │Prometheus│            │  Coolify    │
       │   API    │           │          │            │    DB       │
       └──────────┘           └────┬─────┘            └─────────────┘
                                  │
              ┌───────────────────┼───────────────────┐
              ▼                   ▼                   ▼
        ┌──────────┐      ┌────────────┐      ┌────────────┐
        │node_exp  │      │postgres_exp│      │pgbouncer_  │
        │          │      │            │      │  exporter  │
        └──────────┘      └────────────┘      └────────────┘

                           ┌────────┐
                           │ Redis  │◄──── BullMQ queues
                           │        │      + AutoHEAL config
                           └────────┘
Data flow: The dashboard aggregates information from multiple sources. Coolify API provides application control, direct database queries enable real-time updates, Prometheus delivers metrics, and Redis powers queue monitoring.
Dependency security note: package.json temporarily overrides Next.js's pinned PostCSS with a patched compatible release. Keep the override until Next ships the patched dependency directly; production build, browser smoke tests, and npm audit are the removal gates.
| Endpoint | Method | Description |
|---|---|---|
/api/auth/login |
POST | Authenticate with dashboard password |
/api/auth/logout |
POST | Clear session cookie |
| Endpoint | Method | Description |
|---|---|---|
/api/coolify/applications |
GET | List all Coolify applications |
/api/coolify/deployments |
GET | Get active + recent deployments with stats |
/api/coolify/deployments?view=all |
GET | Paginated deployment history with filters |
/api/coolify/deployments/[uuid] |
GET | Get single deployment with logs |
/api/coolify/deployments/[uuid]/cancel |
POST | Cancel queued/in-progress deployment |
/api/coolify/deploy |
POST | Trigger deployment for an application |
| Endpoint | Method | Description |
|---|---|---|
/api/bullmq/queues |
GET | Get all queue stats with worker health |
/api/bullmq/jobs/failed |
GET | Get failed jobs (supports ?queue= filter) |
/api/bullmq/jobs/failed |
POST | Retry/delete jobs (action: retry, delete, retry_all, delete_all) |
/api/bullmq/queues/[queue]/pause |
POST | Pause queue processing |
/api/bullmq/queues/[queue]/resume |
POST | Resume paused queue |
| Endpoint | Method | Description |
|---|---|---|
/api/health |
GET | Basic health check (public, no auth required) |
/api/postgres/health |
GET | PostgreSQL + PgBouncer metrics |
/api/postgres/backups |
GET | PostgreSQL and Restic backup freshness |
/metrics |
GET | Dashboard self-metrics; requires METRICS_TOKEN |
/api/servers/status |
GET | VPS metrics and site health |
/api/workers/status |
GET | Worker supervisor status (systemd/PM2/Coolify) |
/api/home-network/dns-logs |
GET | Query stored NextDNS logs by device, status, time range, and domain search |
/api/home-network/dns-coverage |
GET | Check expected child devices for recent NextDNS activity |
/api/sse/updates |
GET | Server-Sent Events stream for real-time updates |
| Endpoint | Method | Description |
|---|---|---|
/api/autoheal/config |
GET | Get AutoHEAL configuration |
/api/autoheal/config |
POST | Update AutoHEAL configuration |
| Endpoint | Method | Description |
|---|---|---|
/api/agents/runs |
GET | Get latest run summaries for all agents |
/api/agents/[name]/history |
GET | Get run history for a specific agent (supports ?limit= parameter) |
The dashboard is configured entirely through environment variables. See .env.example for a complete template and docs/configuration.md for detailed explanations.
| Variable | Purpose | Required |
|---|---|---|
COOLIFY_API_URL |
Your Coolify API endpoint | Yes |
COOLIFY_API_TOKEN |
API token for Coolify access | Yes |
DASHBOARD_PASSWORD |
Protects the dashboard with authentication | Strongly recommended |
DASHBOARD_SESSION_SECRET |
Separate HMAC key for session cookies | Yes in production |
METRICS_TOKEN |
Bearer token for the Prometheus self-scrape | Yes in production |
Security note: Always set all three production secrets, keep them in a secret manager, and place the public hostname behind an identity-aware proxy such as Cloudflare Access.
/metricsfails closed if its token is absent.
docker build -t infra-dashboard .
docker run -p 3000:3000 --env-file .env.local infra-dashboard- Create application from Git repository
- Set build pack to Dockerfile
- Configure environment variables in Coolify UI
- Ensure container is on the
coolifyDocker network to accesscoolify-db
The dashboard uses Server-Sent Events (SSE) to push updates to your browser without page refreshes:
| Parameter | Value | Purpose |
|---|---|---|
| Poll interval | 15 seconds | Balances freshness with API rate limits |
| Heartbeat | 5 seconds | Keeps connection alive through proxies and firewalls |
| Reconnect | Automatic | 3-second delay with exponential backoff |
BullMQ workers are detected via bull:*:stalled-check TTL keys in Redis. Rather than marking a worker DOWN on a single missed heartbeat, the dashboard waits for 5 consecutive failures. This approach:
- Prevents false positives during brief network hiccups
- Handles temporary high load without alerting noise
- Ensures genuine worker issues are caught reliably
| Connection | Method | Purpose | Performance |
|---|---|---|---|
| Coolify DB | Direct PostgreSQL | Real-time deployment tracking, site health | Sub-second updates |
| Metrics DB | Prometheus queries | Time-series metrics, historical data | Optimized for analytics |
| Queue State | Redis | BullMQ job states, worker status | Instant access |
- Password protection — Optional but strongly recommended via
DASHBOARD_PASSWORD - Session management — httpOnly cookies with 7-day expiration
- Public endpoints — Only
/loginand/api/healthare accessible without authentication - Token storage — All API tokens stay server-side in environment variables
- Changelog — Recent updates and version history
- Contributing Guide — How to report issues, suggest features, and submit PRs
- Security Policy — Reporting vulnerabilities and best practices
- Project Status — Auto-generated recent activity summary
Built with ❤️ for the self-hosting community
MIT License · GitHub · Issues